Chainflip's onchain data is now live on Token Terminal. Every core metric, 43 in total, is tracked from genesis and updated daily, so anyone can check the protocol's revenue, volume, and staking figures without taking our word for it.
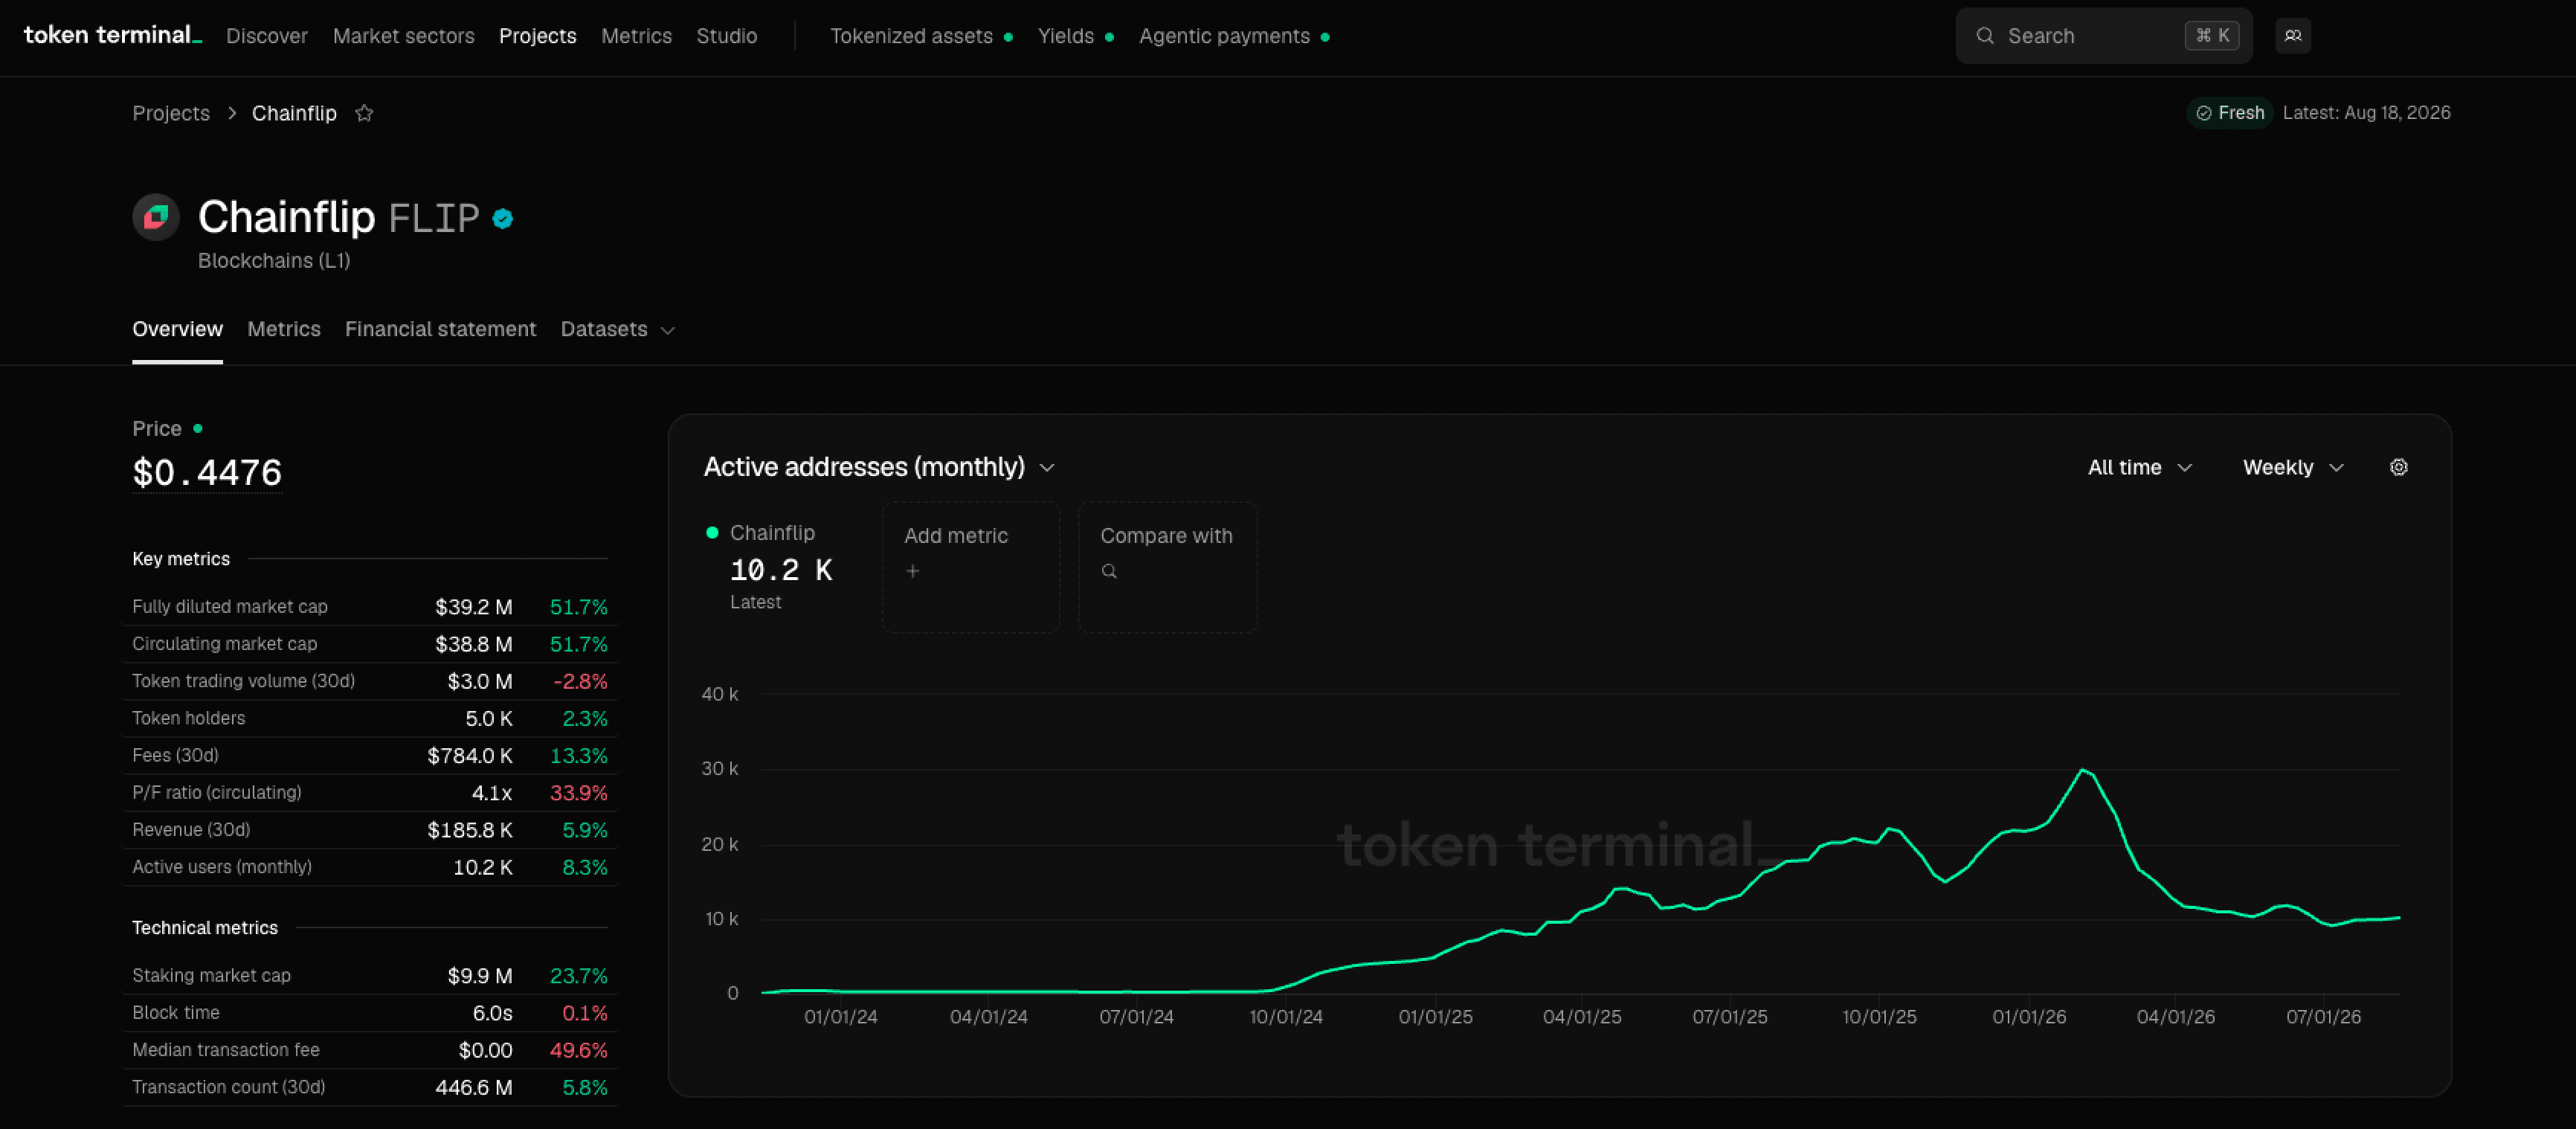
View Chainflip's dashboard directly at Token Terminal.
A non-custodial protocol shouldn't ask you to trust its numbers
Until now, verifying Chainflip's revenue, swap volume, or staking numbers meant pulling them yourself from the block explorer or asking us directly. For a protocol that runs fully non-custodial and settles every swap onchain, that is not a good enough standard for transparency.
Token Terminal closes that gap. It computes the metrics independently from onchain activity using its own standardized methodology, giving liquidity providers, researchers, and holders a single, third-party view of what the protocol is actually doing.
43 metrics, tracked from genesis to today
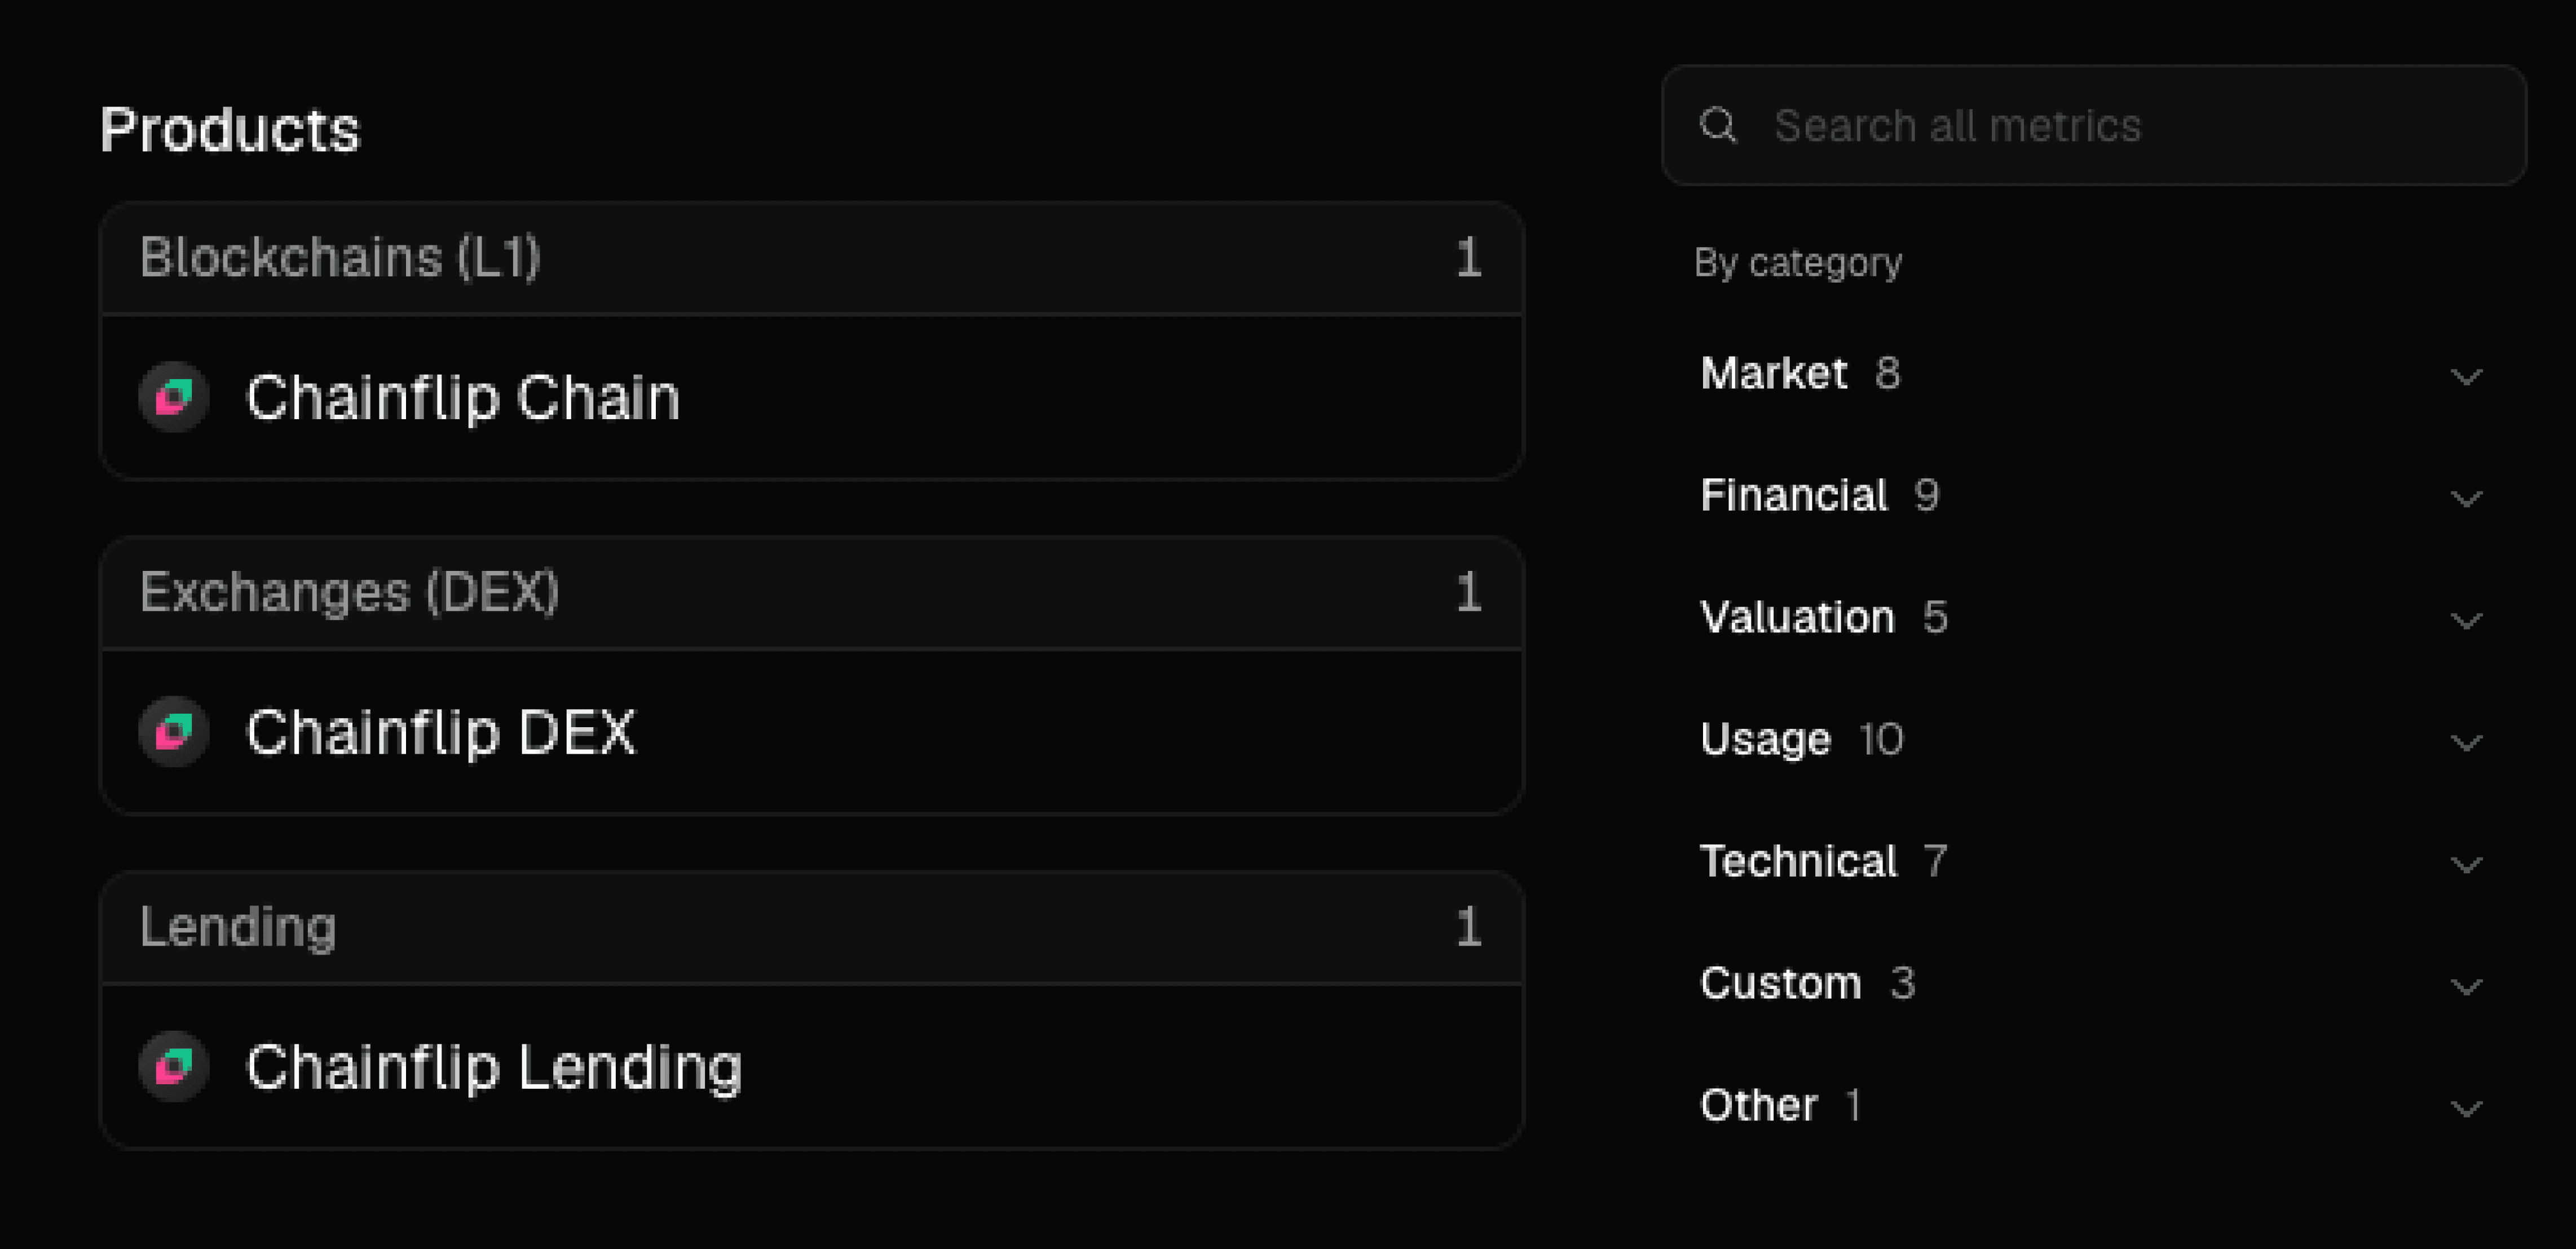
The dashboards covers three product segments: Chain, DEX and Lending, and is further divided into the categories: market, financial, usage, valuation, and technical data.
We break down six of these metrics that cover most of what people ask us for.
Fees and revenue
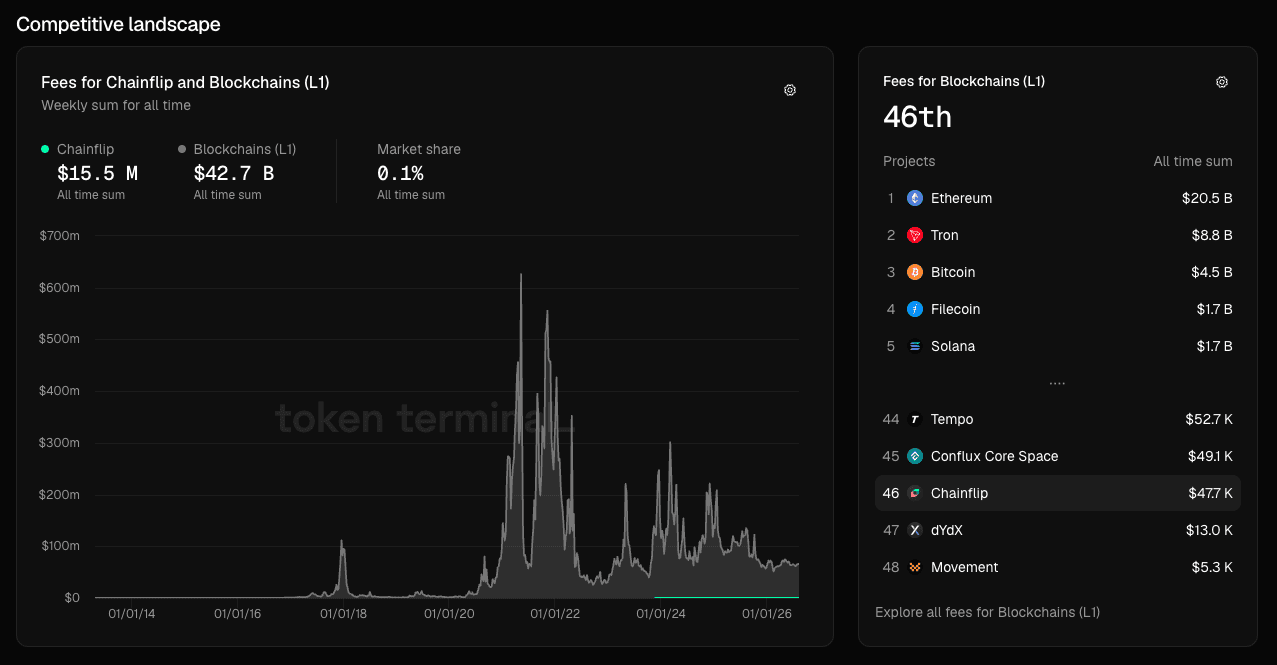
Protocol fees and revenue, charted from the first day of mainnet. This is the clearest read on whether swap activity is translating into real economic output for the network.
Fees:

Trading volume
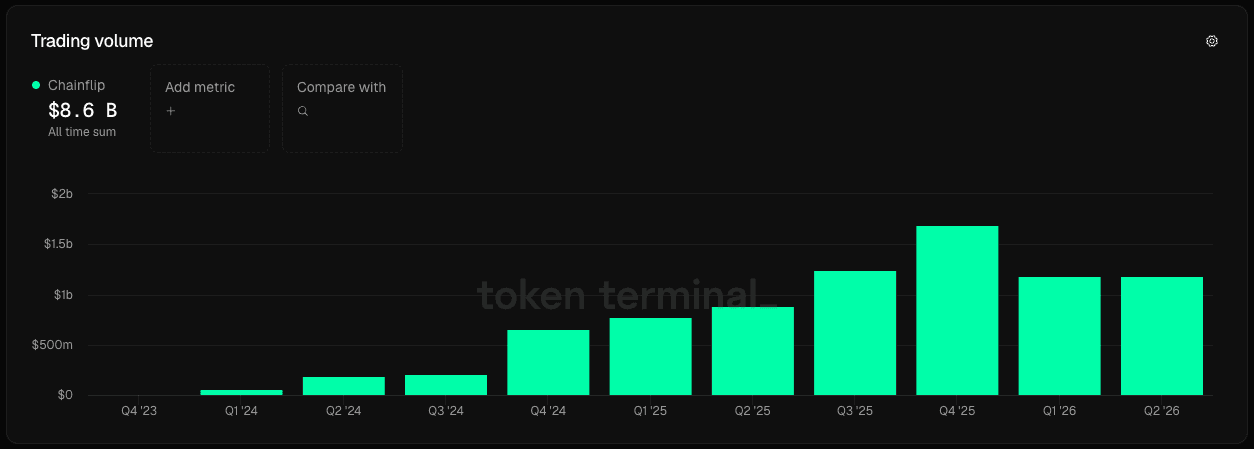
Swap throughput over time, labelled "Trading volume" on Token Terminal. It is the single best proxy for how much the protocol is being used, day to day and cumulatively. They also offer a quarterly view as seen below.
Active users and active addresses
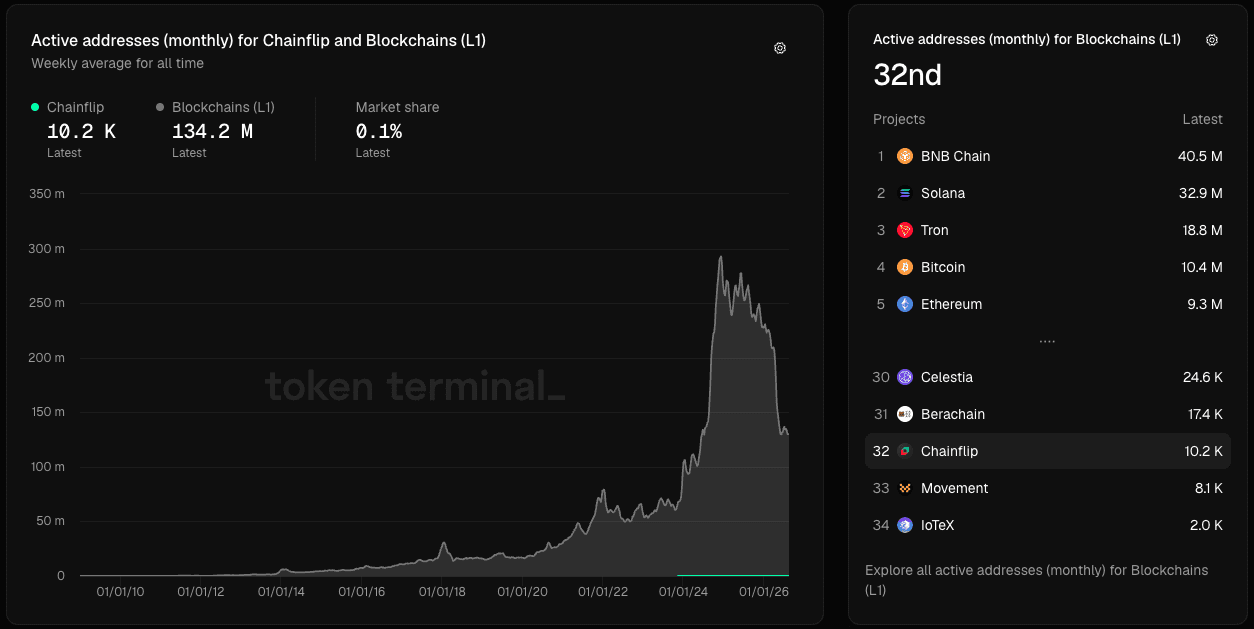
Daily, weekly, and monthly active users and addresses. Volume can spike on a few large swaps, so this is where you see whether real, recurring demand is behind the numbers.

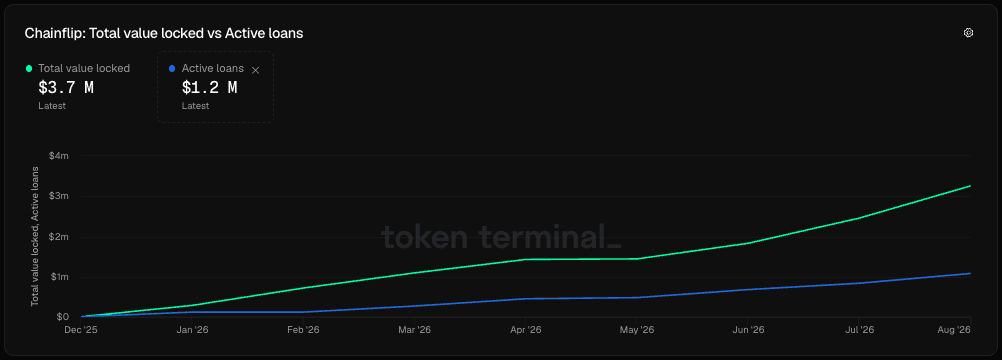
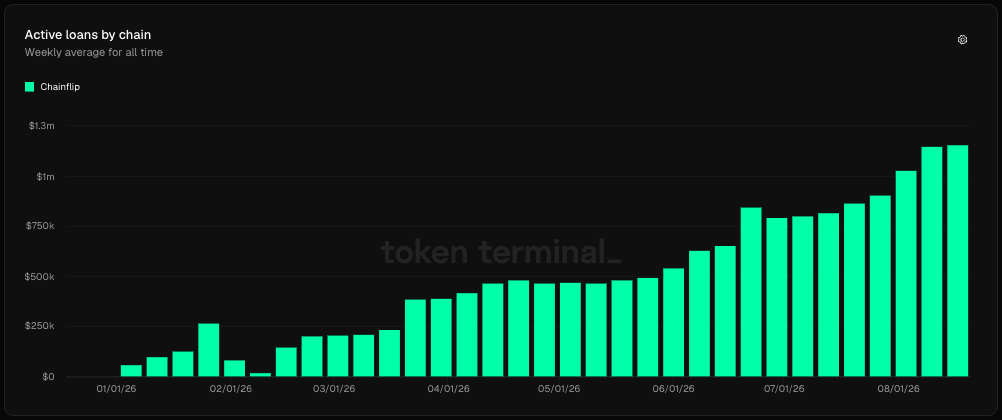
Total value locked alongside active loans from Chainflip's native BTC lending. Together they show how much capital sits in the protocol and how much of it is being put to work.
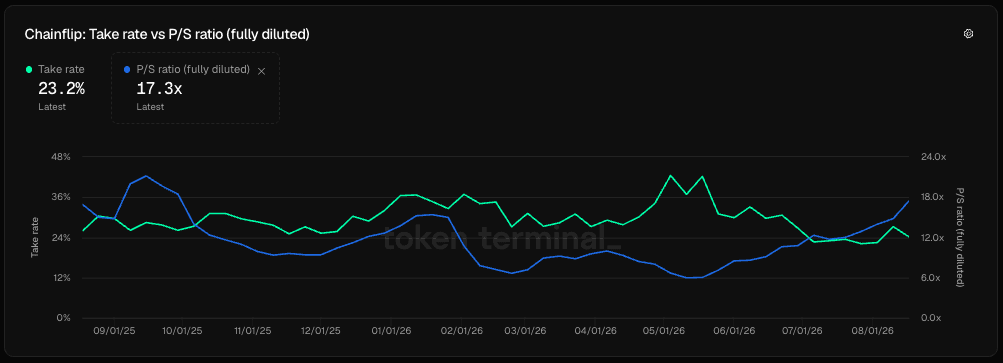
Take rate and P/S ratio
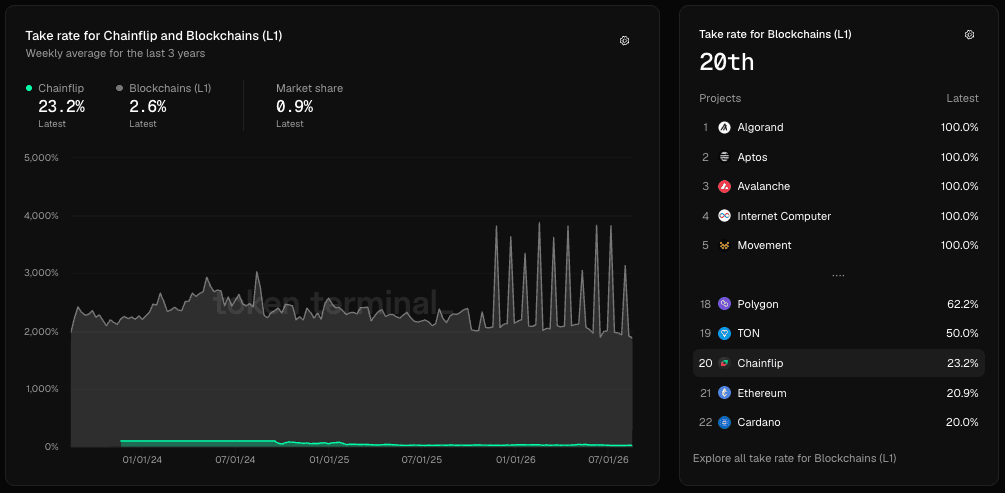
The valuation lens: how much of each dollar of volume the protocol keeps as revenue, and how the market prices that revenue. This is what a block explorer cannot show you, and it lets you compare Chainflip against other DeFi protocols on the same basis.
FLIP supply, market cap, and staking
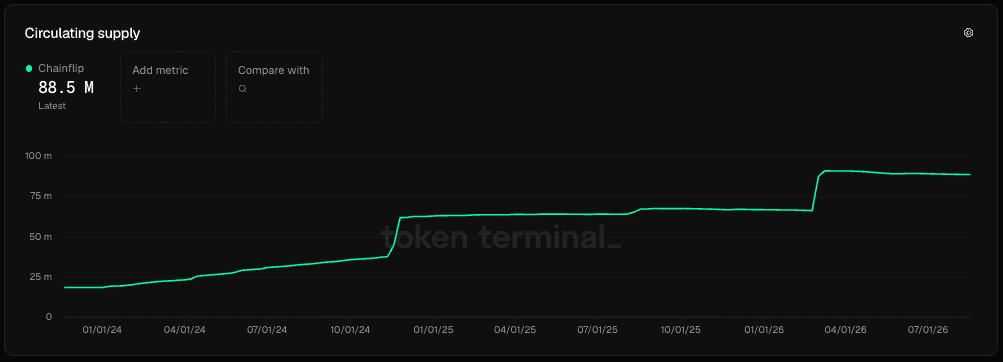
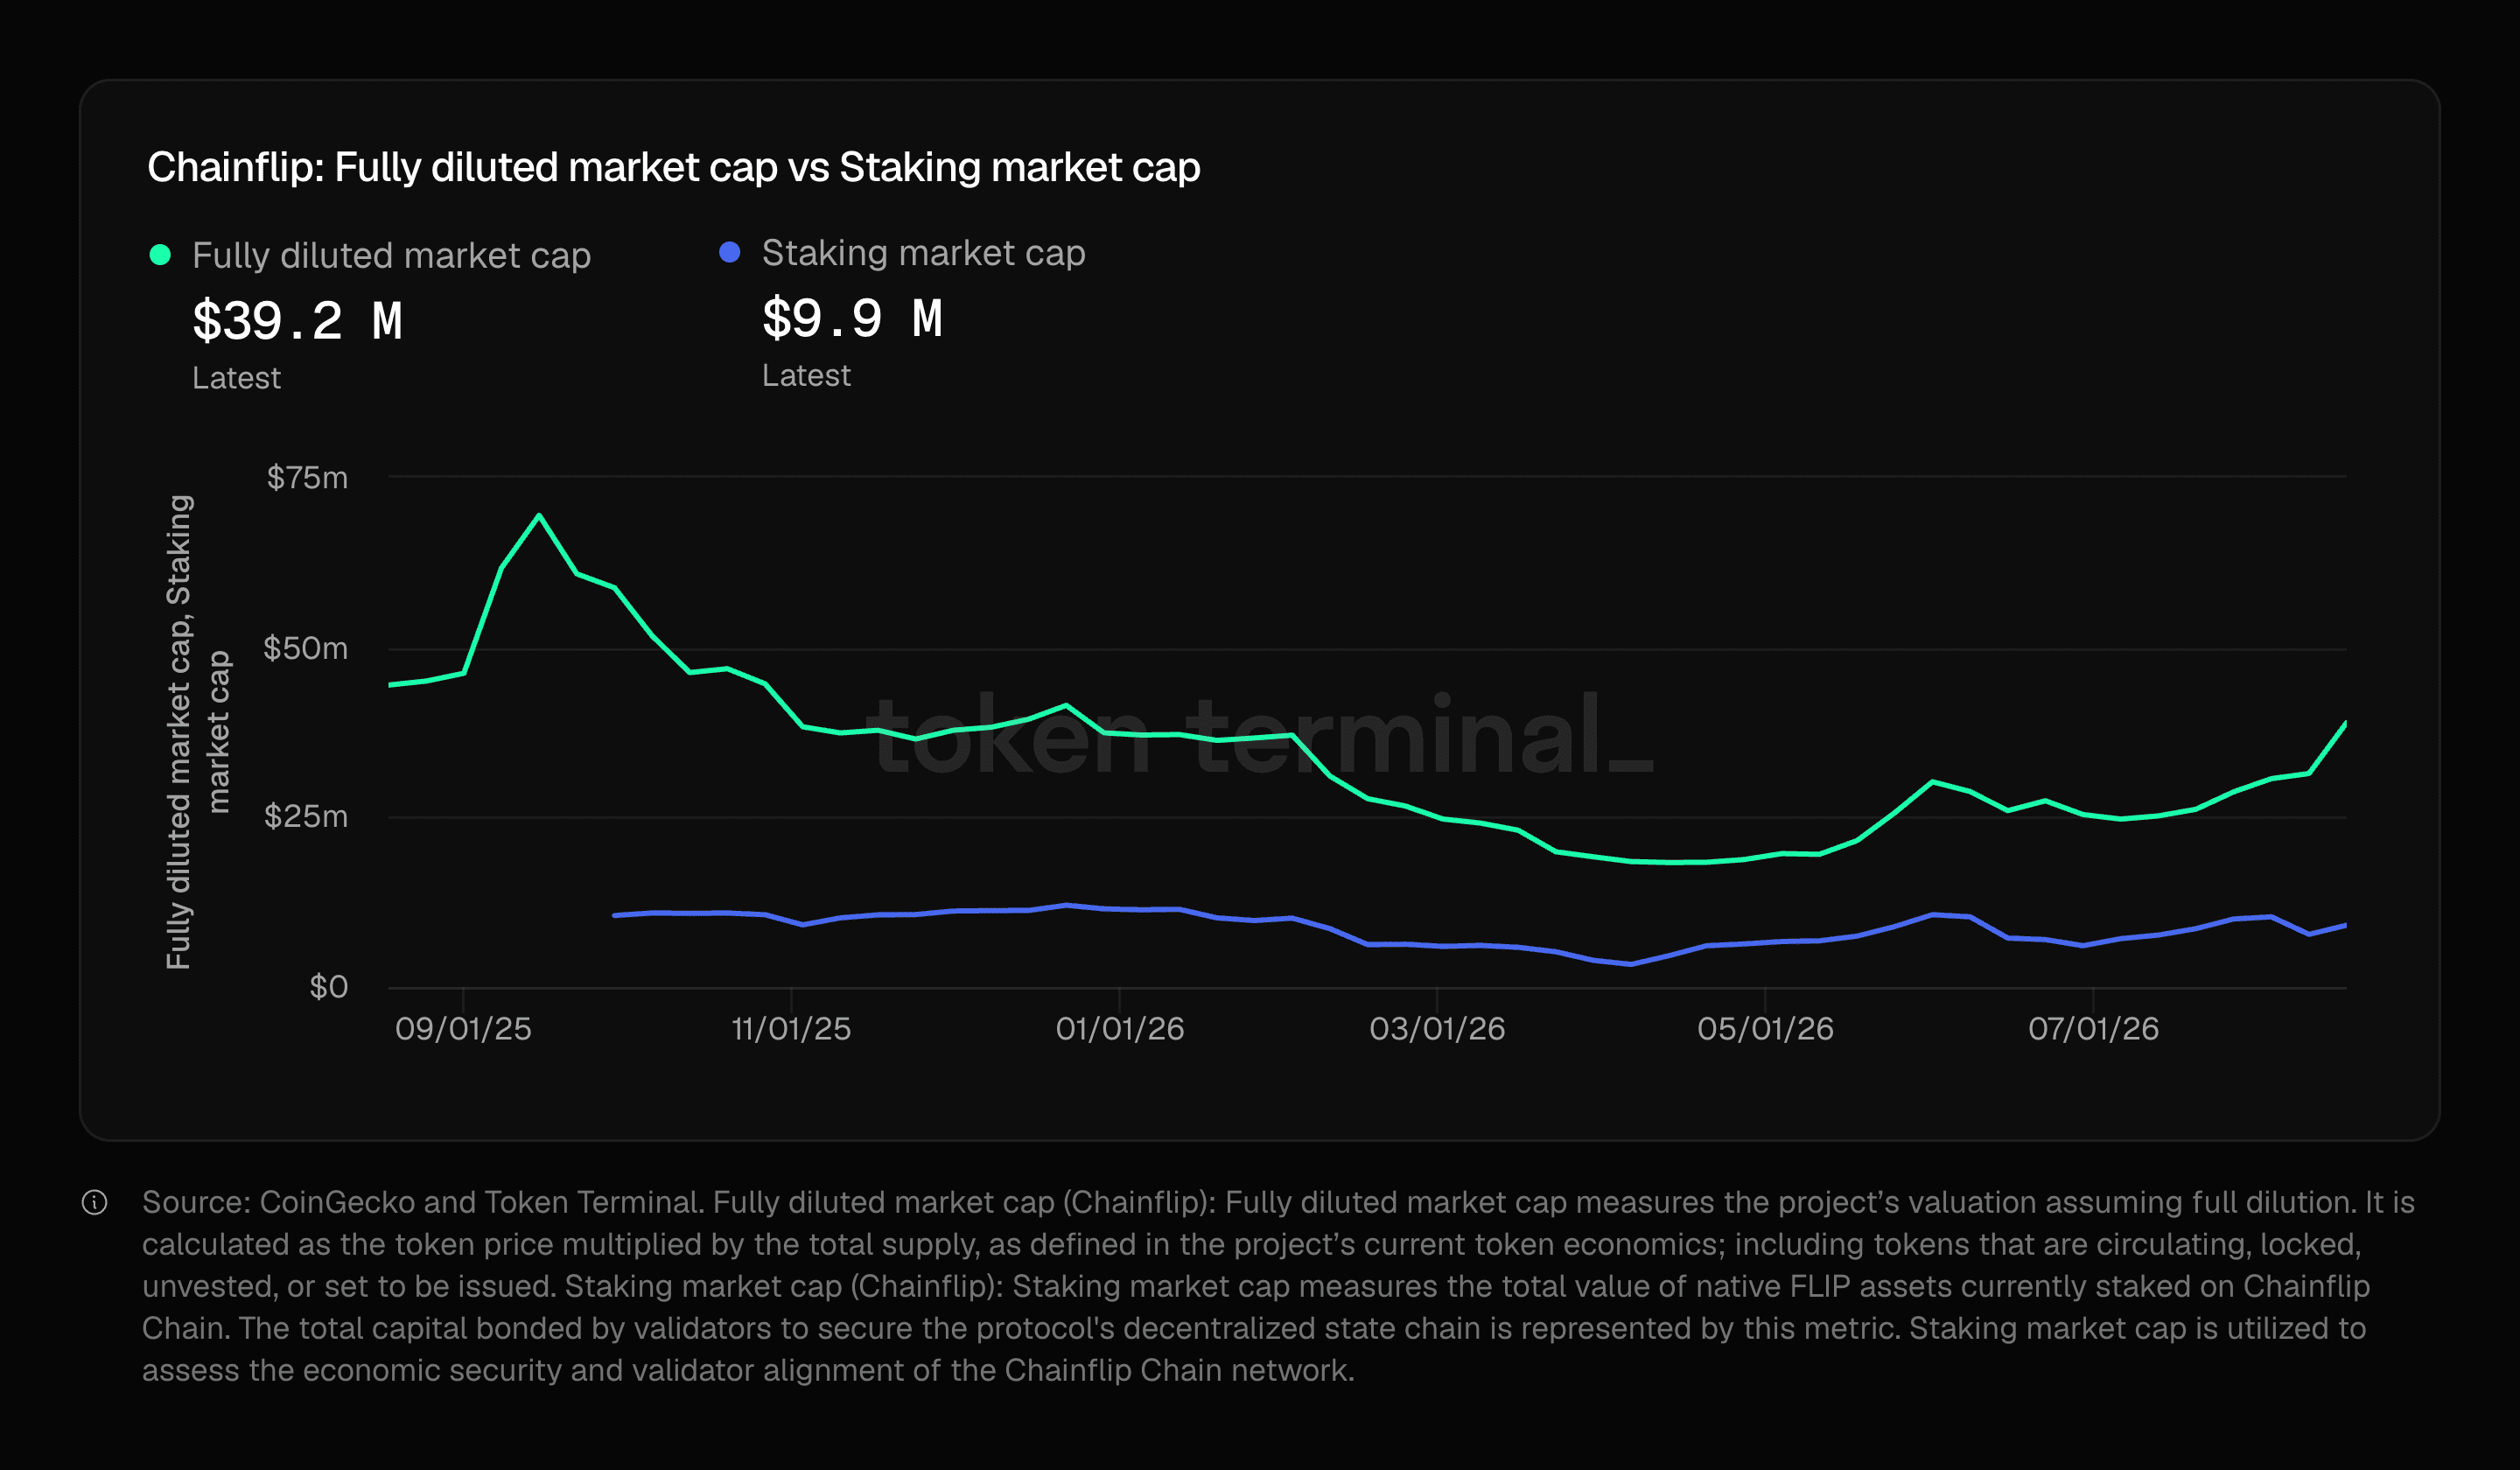
Circulating supply, circulating market cap, staking market cap, and the number of validators securing the network. This is the token and network-security picture in one place.
What changes for LPs, researchers, and holders
Liquidity providers can underwrite risk against real revenue and volume history instead of promises. Researchers and analysts get a clean, queryable dataset rather than scraping RPC calls or indexing the chain themselves.
For holders, it means every public claim we make about Chainflip's growth can be checked against an independent source. The protocol has now settled more than $8.58B in all-time swap volume, with recent expansions including TRON and BNB Chain (soon), and that trajectory is now visible to anyone.
Go check the numbers yourself
The dashboard is live now: Chainflip on Token Terminal. It is meant to be a living source of truth for the protocol, so if a metric looks off or you want to see something added, tell us.
Resources
Swap - Start swapping native assets
Lending - Borrow against native Bitcoin
Blog - Product updates and announcements
Chainflip Scan - Track swaps and network activity
Website - Explore Chainflip
Earn with Chainflip:
Boost - Earn fees by providing single-sided liquidity with no IL risk
Stablecoin Strategies - Deposit stablecoins and earn optimized yields
Provide Liquidity - Supply assets to Chainflip's liquidity pools
Stake FLIP - Delegate FLIP and earn staking rewards
Find us:
How often does the Token Terminal data update?
The metrics update daily and are tracked from genesis, so you get both the latest figures and the full history in one place.
Did Chainflip supply the data, or does Token Terminal calculate it?
Token Terminal derives the metrics independently from onchain activity using its own standardized methodology. That is what makes the dashboard a third-party check rather than a self-reported one.
How is this different from Chainflip Scan?
Chainflip Scan shows transaction-level detail for individual swaps and network operations. Token Terminal aggregates that activity into standardized metrics you can compare against other DeFi protocols.
Where do I find the dashboard?
It is public and free to browse at tokenterminal.com/explorer/projects/chainflip.