Chainflip is a decentralized cross-chain swap protocol that lets users move native assets between Bitcoin, Ethereum, Solana, Arbitrum, and other supported chains without bridges, wrapped tokens, or centralized custodians. The protocol earns fees on every swap, on boost liquidity that fronts capital for instant settlement, and on its native BTC lending market. Those fees flow into the buy-and-burn mechanism, where revenue is used to buy FLIP off the open market and remove it from circulating supply.
This post is a snapshot. Where the protocol stands today, what the trailing windows look like, and what the supply dynamics show.
The last 30 days
Per the Burnonomics dashboard, revenue in the trailing 30-day window (snapshot on 26th May) came in at $344.5K, with $279.4K of that retained as protocol earnings. Earnings margin on the window: 81.1%.
Annualized, that's a $4.2M revenue run rate against $3.4M in earnings. The trailing 365-day earnings figure is $1.8M, so the current 30-day window implies an 89% uplift on the rolling annual baseline.
The 30 days alone account for 52% of the trailing 90-day earnings figure. Linear distribution would put that share at 33%. The income statement isn't just expanding, the rate of expansion is accelerating.
The six-quarter arc
The earnings margin trajectory on the dashboard, from Q1 2025 through Q2 2026:
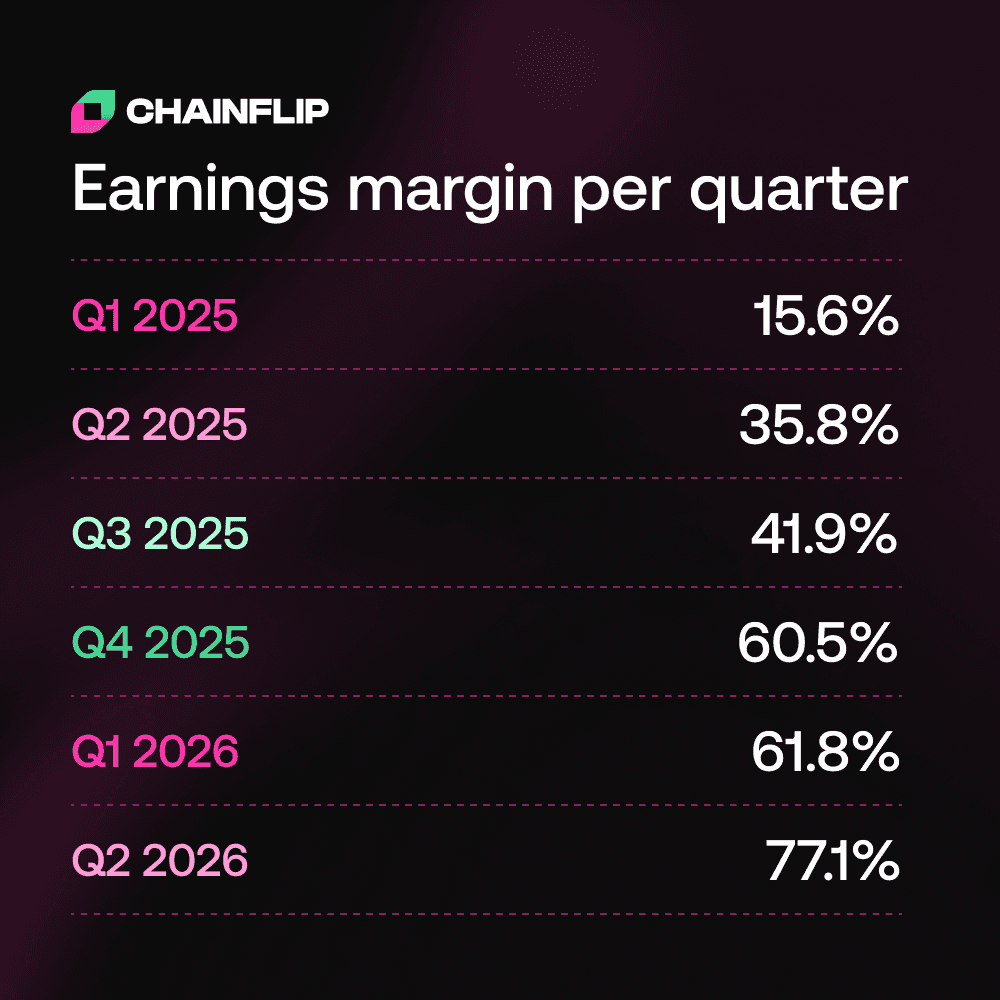
Q1 2025: 15.6%
Q2 2025: 35.8%
Q3 2025: 41.9%
Q4 2025: 60.5%
Q1 2026: 61.8%
Q2 2026: 77.1%
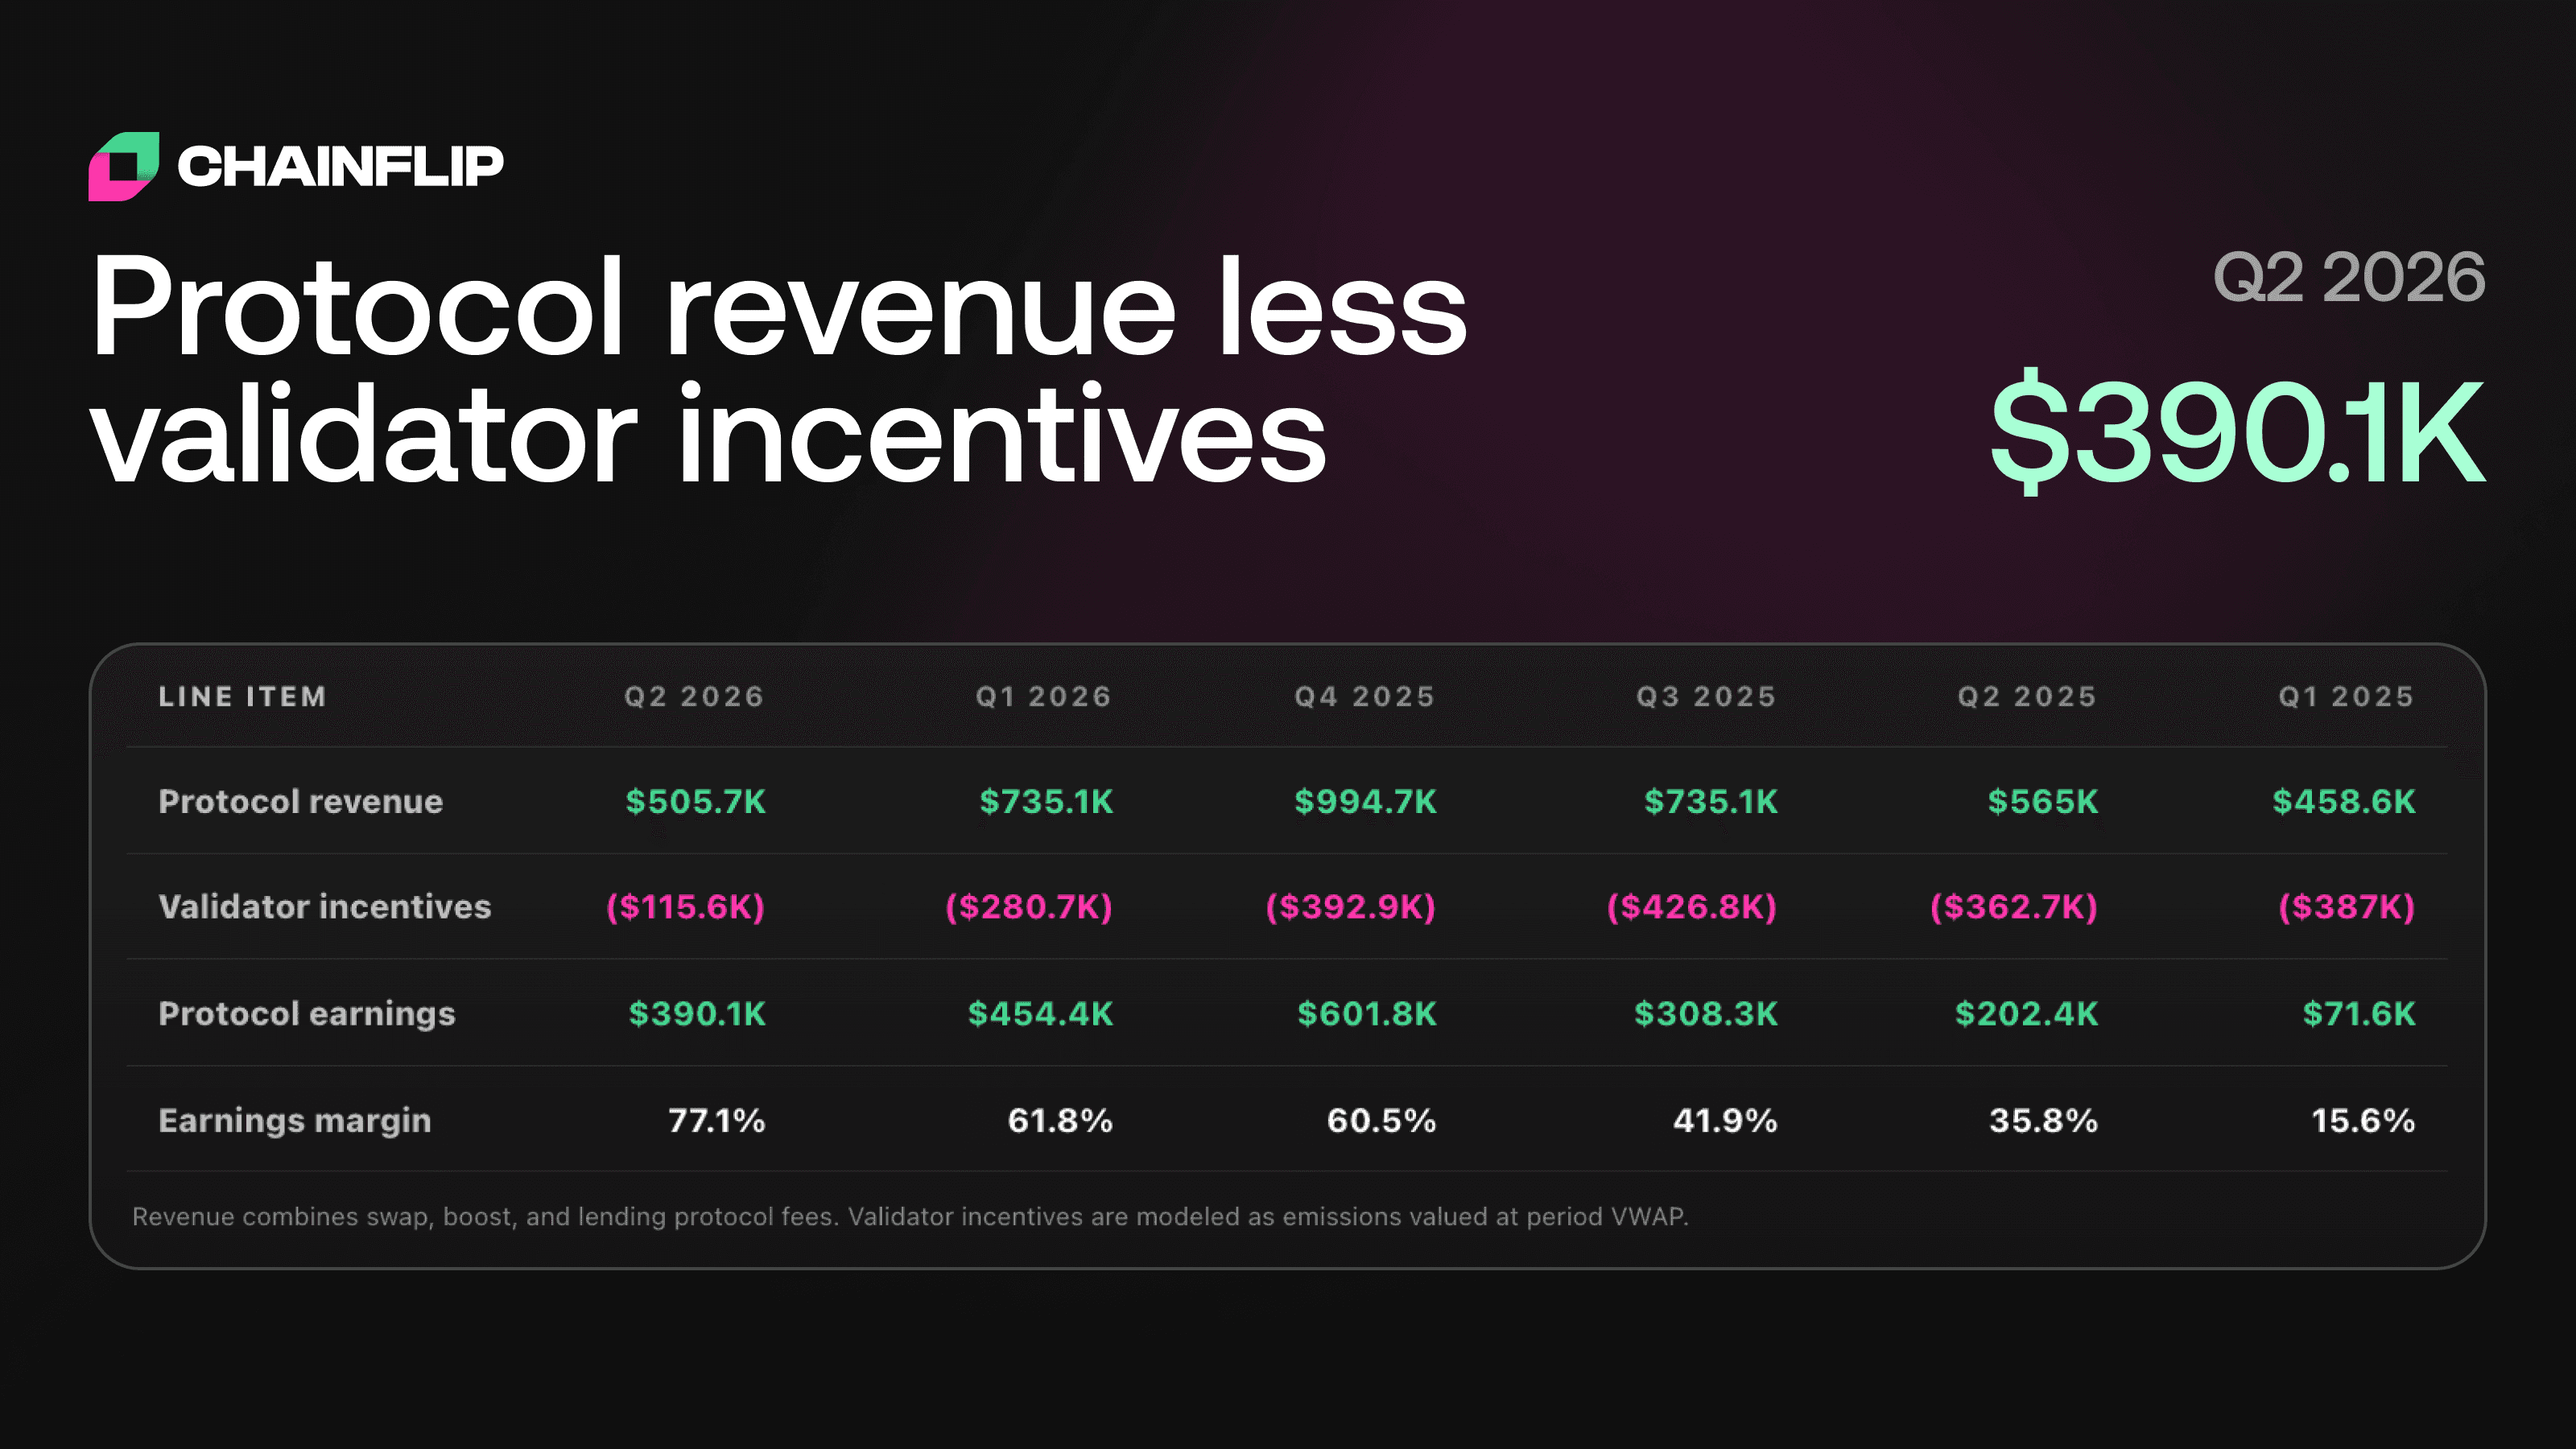
Six consecutive quarters of margin expansion. Q2 2026 earnings were $388.9K on $504.4K of revenue, after $115.6K in validator incentives.
Two things are driving the curve. Revenue from swaps, boost, and lending fees has stayed healthy through the period. And validator incentives have shrunk from $387K in Q1 2025 to $115.6K in Q2 2026, a 70% reduction. More of every dollar earned now stays with the protocol.
What the supply side shows
The protocol uses fee revenue to buy FLIP off the open market and burn it. May 2026 saw 1.4M FLIP burned against 275K FLIP in emissions, for a net supply change of -1.1M FLIP.
The trailing twelve months in context:
Average monthly burn (Jun 2025 to Apr 2026): ~676K FLIP
May 2026 burn: 1.4M FLIP, roughly 2x the trailing average
Previous high: April 2026 at 982K FLIP
Every month in the window has been net deflationary
May emissions of 275K FLIP were the lowest in the period
Cumulatively over the trailing twelve months, 8.83M FLIP was burned against 3.76M FLIP emitted. Net circulating supply contracted by roughly 5.08M FLIP across the year.
Internal flow pressure
The buy-and-burn shows up on the internal flow chart as monthly buy pressure. For most of the trailing twelve months, the net line has hovered around zero, with August through November 2025 running net negative as sell pressure outweighed buys.
May 2026 was the first meaningful net buy month in roughly a year:
Buys: 2.3M FLIP
Sells: 848.2K FLIP
Net: +1.5M FLIP
Gross volume: 3.2M FLIP
The net line on the chart jumps from flat to its highest reading in the visible window.
Valuation context
At current market pricing, the dashboard reports:
Market cap: $27.7M
FDV: $28.2M
Annualized revenue: $4.2M
Price-to-fees ratio: 6.6x
Burn yield (trailing 30d, annualized vs market cap): 15.0%
Revenue per staked FLIP: $0.110
Market cap and FDV are nearly identical, which means there's no overhang of large token releases distorting the picture. The 6.6x price-to-fees multiple sits well below where most revenue-generating crypto protocols trade. The 15% burn yield expresses, in market-cap terms, the rate at which the protocol is currently removing supply.
What changes under FLIP 2.1
The current buy-and-burn model converts fee revenue into supply reduction. FLIP 2.1 changes the destination of that same revenue. Instead of being burned, the FLIP bought on the open market is distributed directly to stakers.
The fees don't change. The on-market buying doesn't change. What changes is who receives the FLIP that gets bought.
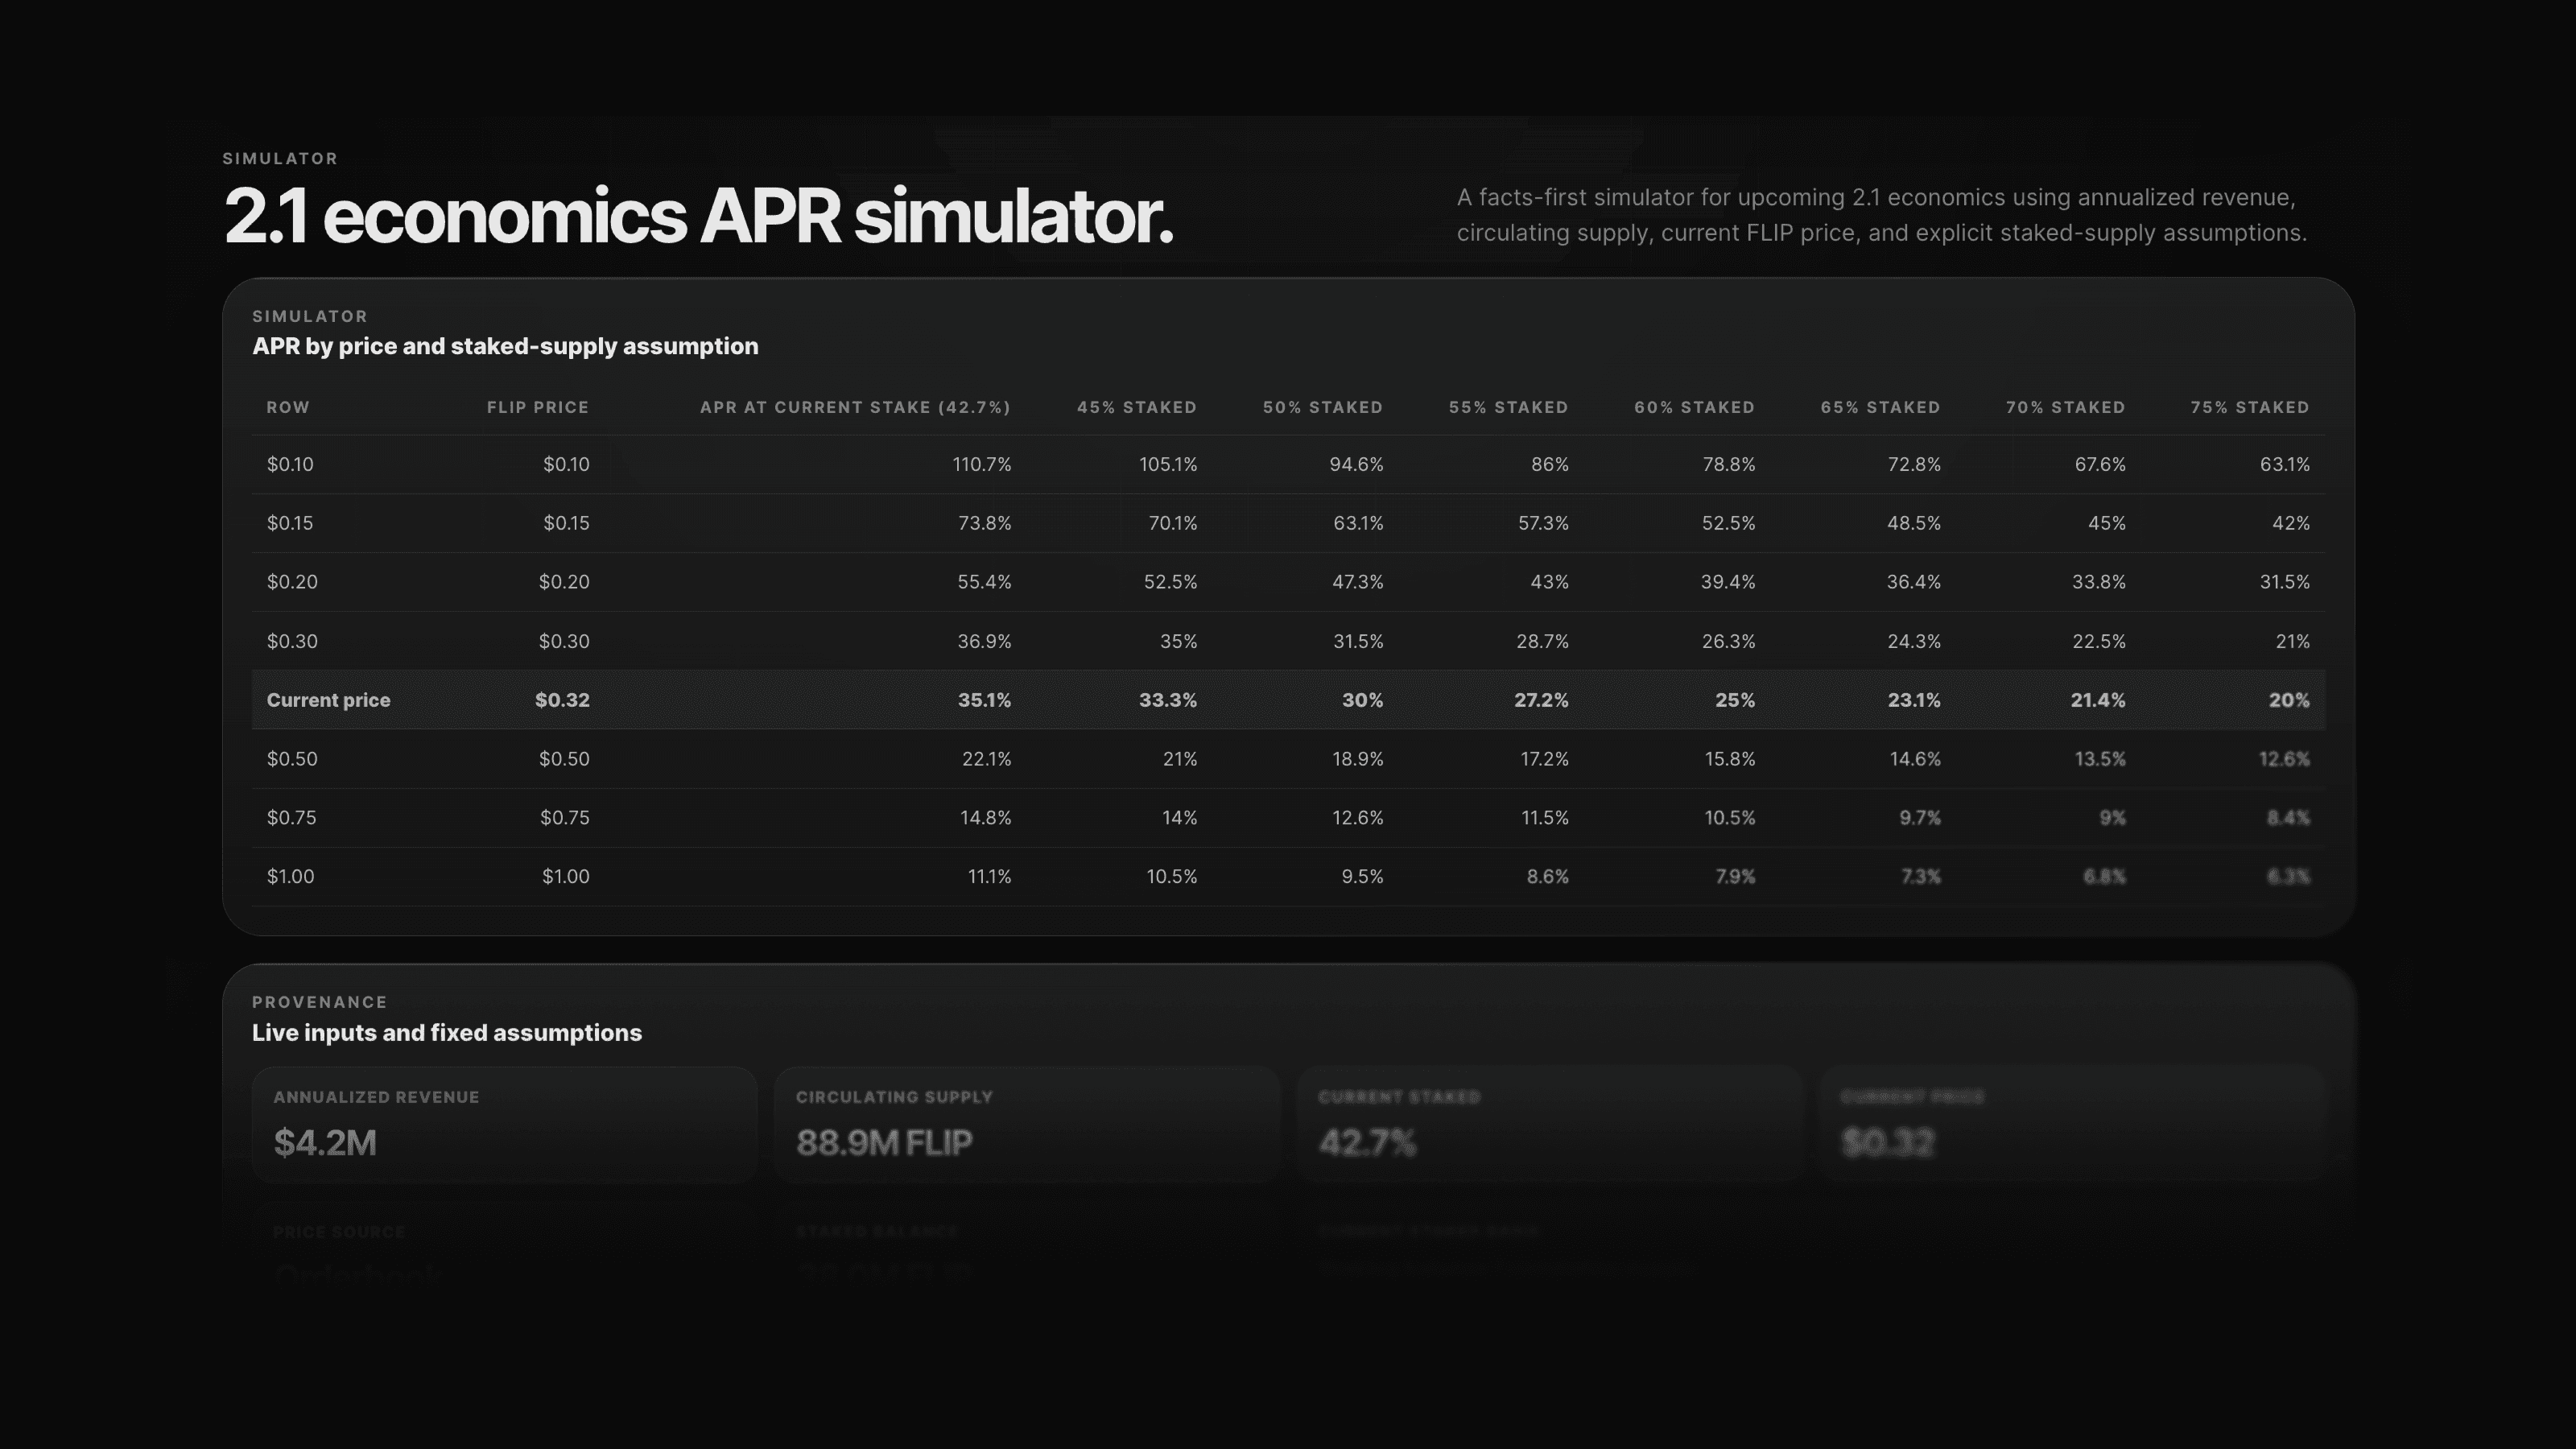
The 2.1 economics simulator on the dashboard models the resulting staker APR using current annualized revenue, circulating supply, FLIP price, and stake rate assumptions. At the current FLIP price of $0.31 and the current stake rate of 42.7%, simulated staker APR is 35.1%.
The simulator shows the sensitivities clearly. A lower stake rate concentrates yield among fewer stakers and raises APR. A higher FLIP price means each dollar of fee revenue buys fewer tokens, which lowers token-denominated yield. At 50% staked, the projection is 30.3%. At 60% staked, 25.2%. The current 35.1% reflects current participation, not a ceiling.
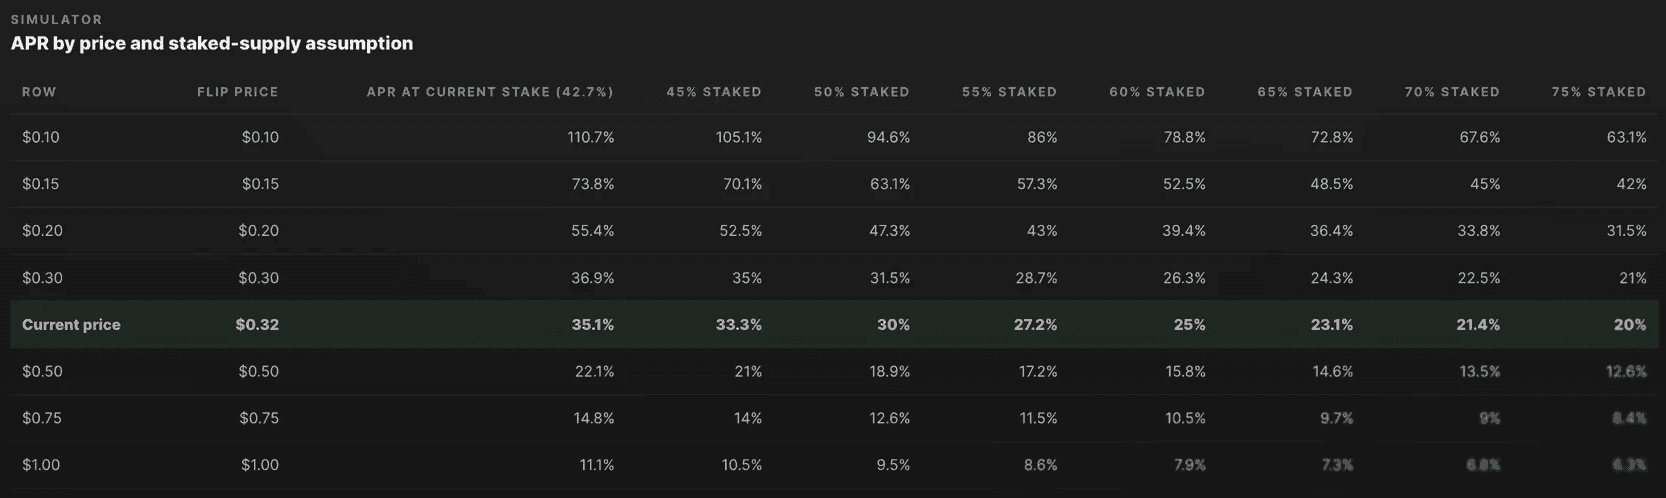
The structural point is consistent across price and stake assumptions. Whatever the protocol earns flows to network participants instead of being retired. A 15% burn yield today becomes the funding source for staker APR tomorrow.
Putting it together
The pieces fit a single loop. Real product usage generates fees. Fees are converted into FLIP buys on the open market. Today, those buys retire supply through the burn mechanism. Under FLIP 2.1, the same buys will fund staker yield instead.
That loop has been running for the full trailing twelve months. What's changed is intensity. The 30-day earnings window is 89% above the rolling annual baseline. The May burn is roughly twice the trailing average. And for the first time in a year, the buy side of the flow chart decisively outweighs the sell side.
None of that is a forecast. It's a snapshot of where the protocol sits today, taken from the live dashboard.
Track the numbers in real time at burnonomics.com.
Resources
Swap Now - Start swapping native assets
Lend BTC - Borrow against native Bitcoin
Blog - Product updates and announcements
Chainflip Scan - Track swaps and network activity
Website - Explore Chainflip
Other Chainflip Products:
Boost - Earn fees by providing single-sided liquidity with no IL risk
Stablecoin Strategies - Deposit stablecoins and earn optimized yields
Provide Liquidity - Supply assets to Chainflip's liquidity pools
Stake FLIP - Delegate FLIP and earn staking rewards
Find us: